Quickly producing time-sequence diagrams
Networking researchers and teachers often need to draw time-sequence diagrams that represent the exchange of packets through a network. Any drawing tool can be used to write these diagrams that contains mainly lines, arrows and text. However, while writing an article or a textbook, switching from the text to the drawing tool can be cumbersome.
A better approach would to write a description of the diagrams directly in the text as a set of commands in a simple langage. Latex hackers can probably manage this easily, but I’m far from a latex guru. Thanks to Benjamin Hesmans, I recently found an interesting software called MSCGen. MSCGen was designed to write Message Sequence Chart descriptions. It produces SVG and PNG images and is integrated with sphinx thanks to mscgen extension. This integration is very useful since it allows to write both images and text directly in ascii.
The langage supported by mscgen is similar to the DOT langage used by graphviz and is very easy to use. For example, the code below
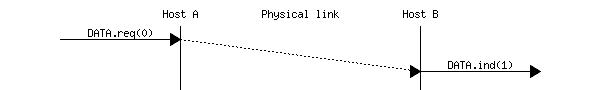
.. msc::

    a [label="", linecolour=white],
    b [label="Host A", linecolour=black],
    z [label="Physical link", linecolour=white],
    c [label="Host B", linecolour=black],
    d [label="", linecolour=white];

    a=>b [ label = "DATA.req(0)" ] ,
    b>>c [ label = "", arcskip=1];
    c=>d [ label = "DATA.ind(1)" ];
Produces the following image.
The only drawback of MSCGen is that it is currently difficult to write a diagram that contains a window of packets that are exchanged and the opposite flow of the acknowledgements. Besides that, I’m planning to use it to produce all time sequence diagrams in the planned revision of Computer Networking : Principles, Protocols and Practice