


Contact
-
EmailFirst.Last@tch.harvard.edu
where First=Maxime and Last=Taquet -
AddressComputational Radiology Laboratory
Boston Children's Hospital
Wolbach 215
300 Longwood Avenue
Boston MA 02115 -
 Add me on Linkedin
-
 Follow me on Research Gate
Projects
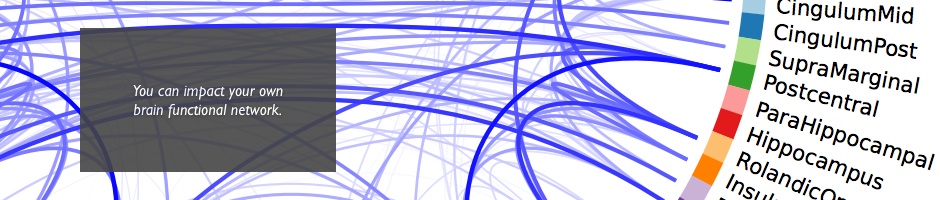
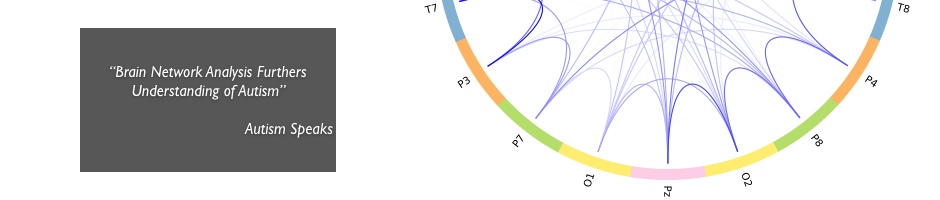
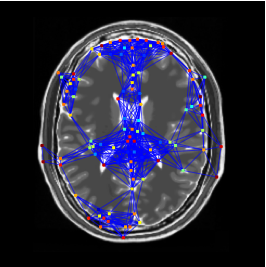
Brain connectivity in Autism Spectrum Disorder

Autism Spectrum Disorder (ASD) is believed to be a disconnection syndrome in which normally functioning brain regions are abnormally connected to each other. Using the graph theory formalism, we analyzed the brain functional networks of children with autism and compared them with a group of healthy volunteers. The analysis revealed that children with autism have altered brain networks compared to their healthy peers.
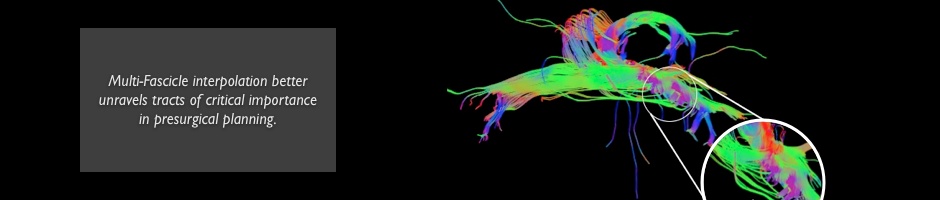
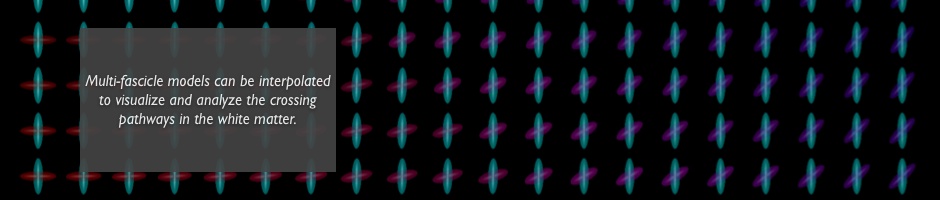
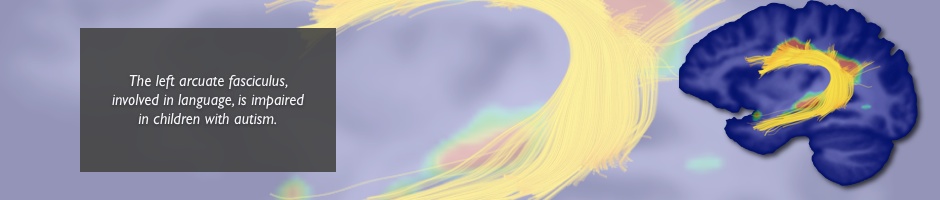
Registration of Multi-Fiber Models

Multi-Fiber Diffusion Models have been introduced as a new representation of the diffusion signal in the white matter. By allowing several fibers to be present at the same voxel, multi-fiber DTI levarage the image accuracy in crossing fibers areas.
In this project, we use multi-fiber DTI to improve the spatial normalization of diffusion images. The idea is based on the processing of gaussian mixture models and the generalization of similarity metrics. The enhanced spatial normalization allows to better characterize the white matter differences between patients with mental diseases and healthy controls.
Morphometry of Mental Disorders
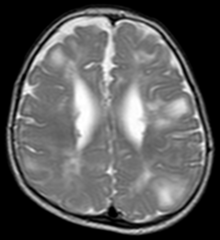
Tuberous sclerosis complex (TSC) is a rare disease which causes cells to grow beyond the stopping criterion of their development. It leads to the growth of benign tumor sites in the brain and other organs such as the kidney, the lungs and the heart. Patients with TSC may suffer mental disorders (such as autism) or may preserve all their cognitive capabilities. The relation between observed features of TSC and the diagnosis of mental disorders remains an open question.
TSC can be detected on MRI by the anatomical shifts due to the presence of large cells. This project aims at extracting information about inter-patients anatomical variability to infer information about the brain areas responsible for mental disorders when affected by TSC.
Exploring the Brain Connectome
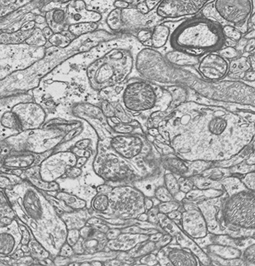
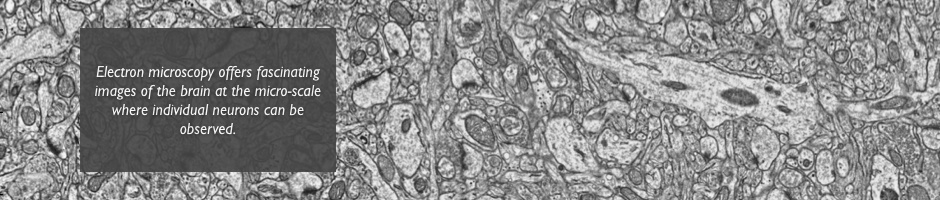
Are human beings determined by the way their neurons are connected with each other, also known as their connetome? How are memories encoded in the brain? Where exactly do mental disorders take place in the complex wiring of the brain? Answers to these questions require technologies to image the brain at the neuron scale and algorithms to efficiently process them.
Transmission electron microscopy (TEM) images offer an insight of the brain in which neurons and their connections, their synapses, can be seen. The volume of data (of the order of 10To for the only visual cortex of a mouse) and the density of information they contain can only be processed by tailored algorithms. The goal of this project is to reconstruct a unique volume of the mouse visual cortex from the hundreds of thousands of bidimensional patches aquired by the electron microscope. This volume will be an invaluable tool to track neuron paths and emphasize their connections.
Comparing Images Based on Graphs
A graph to understand and compare images? In this project, we build image summaries by representing the image as a graph connecting its salient regions. Since a same anatomy can appear with different spatial orientations, the summaries need to be invariant under some spatial transformations, including rotation and scaling. We use a particular theorem of spectral graph theory, related to the Graph Fourier Transform (GFT) to ensure the invariance of our summaries. As a result, the invariant summaries can be quickly computed and compared with each other in a jiffy.