Paraview plugin to visualize high order data
Description
Postprocessing visualization applications such as Paraview are often designed to represent low order data, either constant or linear per element. I wrote a plugin to represent high order fields with Paraview. It is inspired from what is done in Gmsh: when the relative error of representation is too high, the element is recursively split into smaller elements until the provided maximum error is attained. Both element coordinates and field data are computed at the new nodes using the high order shape functions corresponding to the considered element.
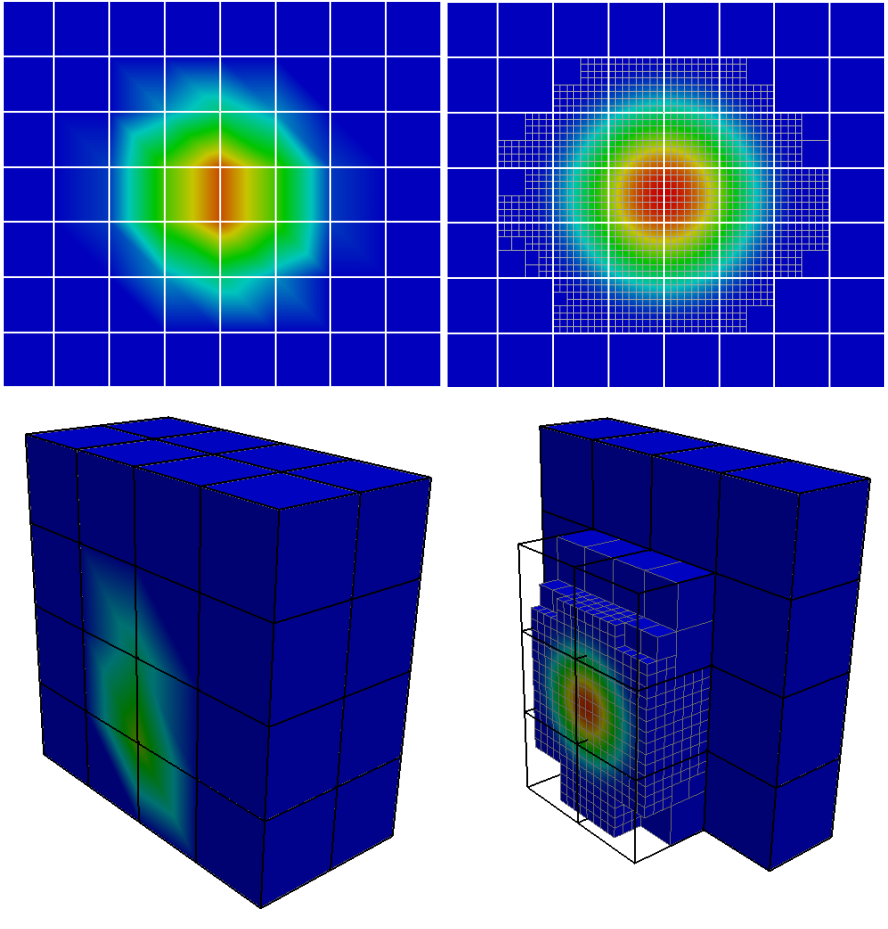
Gaussian bell represented by fifth order elements on two-dimensional and three-dimensional domains, using the plugin with 0 and 3 levels of refinement to increase the resolution where needed.
Current state (most recent changes in bold)
- The plugin currently works with triangles, quads, hexahedrons and tetrahedrons, using Lagrange basis functions to reconstruct the solution and geometry. Prisms could be supported, but I simply do not have any sample file to test them at the moment: ask me if you have such needs. The size of the source files is quite large (shapeFunctions.h was generated using a script), because the relation of recursion is described for several elements with sizes up to a one-thousand nodes hexahedron. I may remove very high order elements in the future.
- Options include the maximum number of refinement levels, the field to be used for error computation and the error tolerance. It is also possible to specify if one or two levels of refinement are used to compute the error.
- Scalar, vector and tensor fields are supported.
- Mix of different types of elements should be supported (not tested).
- If no high order component is provided for the coordinates, the geometry is considered linear by element. This reduces significantly the size of the vtk file and the plugin processing time.
- The plugin icon is not visible. Let me know if you know why, I am a beginner with vtk/Paraview development.
- The code runs in parallel using openmp. The first time the plugin is used on an element type (or when the refinement level is increased for this type) is slower, because the recurrence tree needs to be built for this type of element (serial operation). Then, it is kept in memory.
Downloading and using the plugin
The sources of the plugin, released under the 3-clause BSD license, can be downloaded here. Read the Paraview documentation to compile them. I have versions precompiled on Linux 64 bits for Paraview 4.0.1 and Paraview 4.1.0 (they may not work on your machine, then recompile the sources). The vtk file must be written according to the following rules, in order for the plugin to read it:
- It must be a vtkUnstructuredGrid file. No other formats are allowed.
- Since the plugin handles the high order representation by itself, low order elements must be used in the mesh description (e.g. VTK_TRIANGLE and not VTK_QUADRATIC_TRIANGLE). Hence, only the points corresponding to the linear elements need to be written. For data fields, the degrees of freedom associated with the corners of the low order elements (e.g. 4 corners for a quad, 3 corners for a triangle) must be written as PointData. Hence, it is possible to read the vtk file without the plugin to display the fields using a representation linear by element.
- Additional high order degrees of freedom are stored as CellData. They have the same name as the corresponding low order field (PointData), to which "_HOsol_i" is appended (i is replaced by an index starting at 0). The number of CellData arrays for each field will determine the order of the polynomial basis. Additional high order components for the geometry are written similarly, but named "HOcoord_i". Those additional components are optional and may not be used if the geometry is linear by element (straight edges).
A sample vtk file is available here (do not click, use right-click then save as). The header of the file can be read using a text editor to figure out which is its structure. If the instructions are not clear enough, contact me. The plugin is not polished and far from perfect; any comment is welcome.
Plugin fork
The plugin has been forked by the Zenotech simulation software company. For those interested in the modified version, it has been made available on GitHub.